
Cognitive Task Analysis:
Mapping the Performance
Cognitive Task Analysis (CTA) is the study of what people know, how they think, how they organize and structure information, and how they learn when pursuing an outcome they are trying to achieve.
The Analysis phase includes capturing the skills required for performance. While there are several methods for capturing these performance, ISD normally only lists Behavioral Task Analysis. However, many tasks are largely covert and nonprocedural in nature, thus they require a Cognitive Task Analysis. The solution of course is to plug the desired method or tool into the ISD or ADDIE model as it is quite dynamic, rather than the stale linear model that some believe.
Four analysis tools are discussed:
- Behavioral Task Analysis
- Information Processing Analysis
- GOMS Analysis
- Critical Decision Method
Considerations for Analysis Tool Selection
The performance of a task is normally composed of two types of actions:
- Overt - behavioral and observable (Explicit)
- Covert - mental (cognitive) and not observable (Tacit)
Analysis tools are normal based on the task steps:
- Procedural Analysis Methods - the steps are mostly performed in order and are largely overt actions
- Rule Based Analysis Methods - the steps do not have to be performed in a temporal order and are largely covert actions
Procedural Analysis Methods
These methods are used when there is a temporal order of involved steps, thus there is a set procedure for performing the task. For example, starting a car:
- Unlock driver's door
- Take a seat behind the wheel
- Insert key in ignition switch
- Turn key clockwise
- When engine starts, release the key
Two analysis tools that fall under Procedural Analysis are Behavioral Task Analysis and Information Processing Analysis.
Behavioral Task Analysis
Behavioral Task Analysis is used to capture overt actions by observing and recording an Exemplary Practitioner performing the task. Questions may also asked to ensure the analyst has fully captured the performance. This is perhaps the easiest task analysis method. The output is a list of steps that may also have diagrams or pictures of the desired performance to aid the performers. A simple example for a Data Analyst might be:
- Turn on computer and start spreadsheet application.
- Load projected sales report template (prosale.exl).
- Enter projected sales figures into designated spreadsheet cells.
- Run spreadsheet macros.
- Save file under new name, “pro***.exl”, with *** being the next sequential number. For example, pro135.exl. Note: Do NOT overwrite template.
- Email the spreadsheet to the Planning Manager.
If no Exemplary Practitioners can be found, such as the task being new, Subject Matter Experts (people who know about the subject but are not present performers) are interviewed to determine the best task steps. This is normally a prototyping method in that it may have to be repeated a few times to pinpoint the best steps for performing the task.
Depending upon the learners' prior knowledge and the complexity of the task, the list might also contain substeps as shown in this example:
- Turn on computer
- Start spreadsheet application
- 2.1 Click the Start icon
- 2.2 Scroll through the menu list and select the Excel application
- Load projected sales report template (prosale.exl).
- 3.1 Click on the file menu
- 3.2 Click on the Open option
- Etc., Etc.
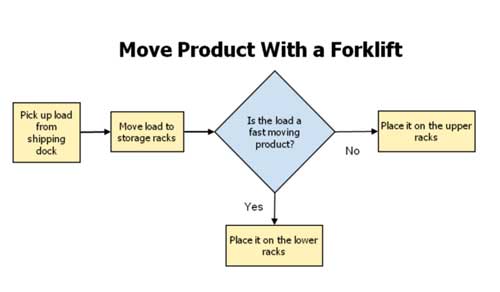
Information Processing Analysis
The Information Processing Analysis tool (van Merriënboer, 1997) is used when there are both overt steps that require a set order and covert steps that require decision making of a yes or no nature. The overt actions are captured by observing and recording an expert performer, while the covert actions are captured by having the expert performer talk about their actions (thinking aloud). Capturing the decision-making process makes it more difficult than the Behavioral Task Analysis, but it is perhaps the most common method as the majority of tasks require certain decisions to be made. The output is commonly a flow chart composed of three elements that outline the task steps:
- Boxes - overt or covert actions
- Diamonds - decisions
- Arrows - order of steps
This is a short example of a flowchart showing the decision making process that a forklift operator must make when moving material from the receiving dock to a storage area:
Rule Based Analysis Methods
These methods are used when there is NO temporal order of involved steps, thus there is not a set procedure for performing the task. In addition, most of the task steps are normally of a overt nature. Two tools that fall under Rule Based Analysis are GOMS Analysis and the Critical Decision Method.
GOMS Analysis
The GOMS tool analyzes a task by examining four elements of it (van Merriënboer, 1997):
- The Goal represents the intention to perform a task and its underlying structures, such as subtasks, cognitive operations, and physical operations. For example, an instructional designer may have a task of training a new sales person the skills to sell a product. The task includes subtasks of analyzing the skills needed, selecting activities, etc. The instructional designer uses cognitive operations, such as selecting an activity that actually teaches the skill and determining if the chosen media can effectively deliver the activity.
- Operations represent the physical actions, such as binding a learner's manual or typing on a keyboard. It also includes mental operations, such as retrieving from memory or setting a goal.
- Methods represent sequences of operations that accomplish goals or objectives. It includes high-level goals that breaks a tasks into subtasks and low-level methods that are the actions that actually perform the subtasks.
- Selections Rules represent the context for selecting a particular method. That is, there may be several ways to accomplish a goal or task, but one may be chosen because it should perform this particular task the best (heuristics).
Capturing the performance of a covert task can be done in many ways and normally several are used to capture the task. Some of the more common ones are interviews, job shadowing, having an expert performer think-aloud, and storytelling.
The GOMS analysis can normally best be represented by a concept or mind map. The Goals will normally be placed on the map first, which are then followed by placing the Methods and their Selection Rules on the map. The details (Operations) are then listed. Shown below is a partial mind map of selecting an analysis tool:
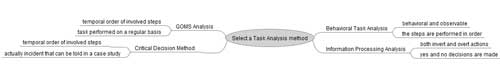
Depending upon the size and the scope of the task, you might have to link or reference other documents that go into more specifics about the Operations, Methods, and Selections rules. However, be careful as one of the common mistakes in GOMS analysis is getting too specific, which results in long and detailed procedural descriptions that are difficult to follow.
Critical Decision Method (CDM)
The Critical Decision Method tool can be thought of as a Case Study, however, it also includes a visual reference or map (Crandall, Klein, Hoffman, 2006). Just as a case study uses an actual incident to tell a story, CDM is also performed by having an expert tell a story about a particular task they performed in the past. For example, an Instructional Designer might tell how he developed a Just-in-Time program for training sales persons to sell a new product or a fire fighter might tell about the actions she took in fighting a gas station fire. Note that when the person tells the story, the interviewer might have to probe to gather some details. The interview is normally divided into four sweeps (phases) as described below. While the output might include a written case study, it should normally include a map similar to this:
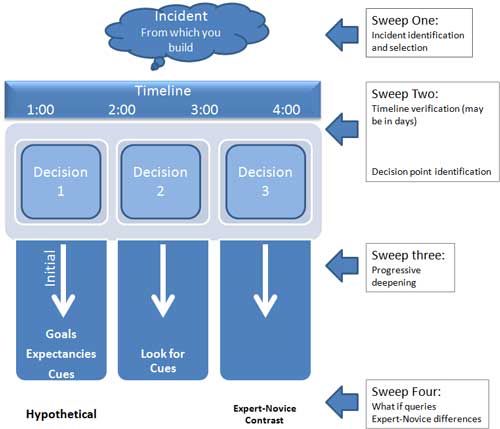
The CDM process goes like this:
- Sweep 1 - Identify a incident. It should come from a decision maker who was involved rather than a witness.
- Sweep 2 - The expert tells his or her story. Identify the key decision points and when they were made.
- Sweep 3 - These is where you “deepen” the interview by asking for analogs, mental models, other options, experience or training that was helpful, etc.
- Sweep 4 - Finally ask “What If” questions, such as “If the situation had been different what would have happened?”, or “What if a novice had been in charge?”
Key Points
The finale outputs, such as a list of task steps, flowchart, mind map, or CDM chart prove not only invaluable to the design team, but may also make excellent performance or learning aids. Just as it is as important to use a correct analysis tool, it is also just as import to represent the findings in a manner that others can understand.
The final output might not be just one chart, but rather a combination of them as shown in the diagram below. Also the chart does not have to be combined into one page if it gets too cluttered, but may be composed of a collection of documents that are linked together electronically or referenced if they are printed. In addition, other types of charts and visualizations representations may also be used.
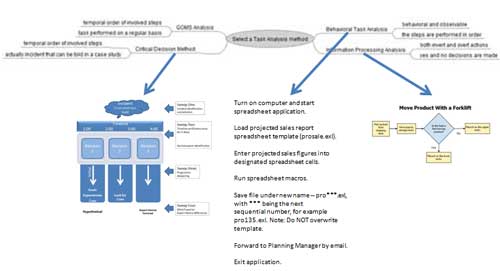
Click here for a larger chart
Next Steps
Next Section: Build Performance Measures
Return to Task Analysis in Instructional Design
Return to the Table of Contents
Pages in the Analysis Phase:
-
Compile Job and Task Inventory
References
van Merriënboer, J.J.G. (1997). Training Complex Cognitive Skills: A Four-Component Instructional Design Model for Technical Training. Englewood Cliffs, NJ: Educational Technology Publications.
Crandall, B., Klein, G., Hoffman, R.R. (2006). Working Minds: A Practitioner's Guide to Cognitive Task Analysis. Cambridge, MA: Massachusetts Institute of Technology.