

Learning and Training: Statistics and Myths
How Effective is Training?
Laurie Bassi measured how well employees are trained and developed (Delahoussaye, et al., 2002). She writes that organizations that make large investments in people typically have lower employee turnover, which is associated with higher customer satisfaction, which in turn is a driver of profitability (p22). A second driver is manager proficiency — good managers determine if people stay or go, and this is also influenced by training and development. She further writes that the education and training variable is the most significant predictor of an organization's success as compared to price-to-earning ratios, price-to-book statistics, and measures of risk and volatility.
Bassi puts her theories to the test — her and a fellow partner launched an investment firm that buys stocks in companies that invest heavily in employee training. It has returned 24 percent a year over the past two years, topping the S&P by four percentage points.
Companies that fail to invest in employees jeopardize their own success and even survival. In part, this practice has lingered for lack of alternatives. Until recently, there simply were not robust methods for measuring the bottom-line contributions of investments in human capital management (HCM) — things like leadership development, job design, and knowledge sharing. That's changed. - Bassi & McMurrer (2007).
For more information, see Laurie Bassi.
Jeffery Pfeffer (1998) writes that “Virtually all descriptions of high performance management practices emphasize training, and the amount of training provided by commitment as opposed to control-orientated management is substantial” (p85). Yet companies seem to be very short-sighted as on the next page he writes that in times of economic stringency, many U.S. organizations reduce training to make profit goals.
Percentage that the Kirkpatrick Model is Used
Bassi, et al (1996) reported that 96% of companies surveyed used some form of the Kirkpatrick framework to evaluate training and development programs.
Twitchell, Holton, and Trott (2000) performed a meta-analysis of studies performed in the last 40 years. Their research indicates the following ranges for the use of Kirkpatrick's four levels:
- Level 1: 86-100%
- Level 2: 71-90%
- Level 3: 43-83%
- Level 4: 21-49%
Training Expenditures
Total 2012 U.S. training expenditures, which includes payroll and spending on external products and services, fell 6.5 percent to $55.8 billion notes (Training Magazine, 2012). While training payroll increased, from $31.3 billion to $36.4 billion, spending on outside products and services decreased $1.7 billion to $7.4 billion. The driver of this cutback is mainly decreased government spending as the research conducted by Training Magazine notes:
“Government/ military organizations showed the greatest tendency for training budget cuts, while retailers/wholesalers and manufacturers/distributors showed the largest gains.”
Training expenditures for previous years are (in $ Billions):
- 2011 - 59.7
- 2010 - 52.8
- 2009 - 52.2
- 2008 - 56.2
- 2007 - 58.5
The research paper also notes that slightly more than 45% of training hours are performed in the classroom, 27% is delivered with blended learning techniques, 24.7% is delivered via online or computer-based technologies, and 1.1% is delivered via mobile devices.
Note that in 2006 classroom training accounted for 66% of the training, however blending learning was not in wide use at the time. Since then, blended learning has become more popular as it allows designers to combine the best features of media to create better learning processes.
While the some budgets may be nearly identical to previous years, organizations are getting more training for their dollars since the elearning market has had several major merges and in turn, dropped their prices in order to stay competitive (Training Magazine, 2005). In addition, the advancement of new instructional tools, in particular those that are focused on elearning, make the development process more effective and efficient.
Learning, Training, and Development Staff to Employee Ratio
In 2012, Bersin & Associates found that the average U.S. organization had a 5.2 L&D staff per 1,000 employees and that high-impact Learning Organizations had an average staff of 4.3 L&D per 1,000 learners as they are more efficient, effective, and aligned with the business. However, they spent more — $1,021 per learner, compared with the national average of $800.
ATD found the average number of employees per L&D staff was 299 employees when adjusted for outsourcing; when not adjusted, the number increases to 400 employees to one L&D staff member.
Number of Hours Needed to Build a learning Program
Bryan Chapman listed these average development times:
Development times to create one-hour of training
- 43:1 — Instructor-Led Training (ILT), including design, lesson plans, handouts, PowerPoint slides, etc. (Chapman, 2010).
- 33:1 — PowerPoint to E-Learning Conversion (Chapman, 2006).
- 79:1 — Standard e-learning, which includes presentation, audio, some video, test questions, and 20% interactivity (Chapman, 2010)
- 184:1 — Interactive e-learning, which includes presentation, audio, some video, test questions, and 20% interactivity (Chapman, 2010)
- 490:1 — Highly Interactive, Simulations, Games, e-learning, which includes presentation, audio, some video, test questions, and 20% interactivity (Chapman, 2010)
- 345:1 — 3rd party courseware. Time it takes for online learning publishers to design, create, test and package 3rd party courseware (Private study by Bryan Chapman)
Development times to create one-hour of e-learning (The eLearning Guild, 2002):
- Simple Asynchronous: (static HTML pages with text & graphics): 117 hours
- Simple Synchronous: (static HTML pages with text & graphics): 86 hours
- Average Asynchronous: (above plus Flash, JavaScript, animated GIF's. etc): 191 hours
- Average Synchronous: (above plus Flash, JavaScript, animated GIF's. etc): 147 hours
- Complex Asynchronous: (above plus audio, video, interactive simulations): 276 hours
- Complex Synchronous: (above plus audio, video, interactive simulations): 222 hours
Note that these are averages, thus any one program might take as little one hour or up to 500 hours depending on the person's design skills and knowledge of the subject, amount of material to be converted, and the type of transformation needed.
The Growth of Training
The U.S. will start exporting environmental expertise in large numbers. Environmental engineers will likely see an increase in their profession of better than 54.3%. Thus, they are at the head of the 20 fastest growing job list. And coming in at number 13 are the training and development specialists, who are projected to grow by 22.3%! (Fisher, 2005).
So why is T&D suddenly going to grow? The September 2003 issue of Business 2.0 had an article on how baby-boomers are starting to retire, thus, a lot of expertise is now going out the door. In addition, we are becoming a lot more knowledge dependent. With this shift towards a knowledge economy, I believe that our profession is going to start shifting to the development side. While there is some overlapping between the two, training is normally more beginner-orientated, thus it focuses on new skills; while development is normally more advanced orientated, thus its focus is more knowledge orientated.
This means a shift towards a more constructivist, rather than instructivism design. Beginners tend to need strong frameworks to guide them in their knowledge acquisition, while those who already have a strong knowledge base require more dynamic means as they are looking for specifics to fill their knowledge gaps.
Projected Growth of eLearning
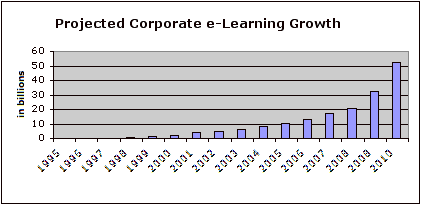
eLearning predicted by IDC to recover again. It is now projected that the eLearning market will hit $52.6 Billion by 2010.
Myth — 10% of Training Transfers to the Job
The Myth: “It is estimated that while American industries annually spend up to $100 billion on training and development, not more than 10% of these expenditures actually result in transfer to the job” or “Not more than 10% of training expenditures actually result in transfer to the job.” We read this on the web, in training magazines (Chief Learning Officer, The Low-Hanging Fruit is Tasty, March 2006 Issue), books (The Learning Alliance by Robert Brinkerhoff and Stephen Gill), and even research papers (Baldwin & Ford, 1988).
However, if you follow the references to the root source, they always lead to an article by Georgenson (1982). It reads in part:
“How many times have you heard training directors say: 'I need to find a way to assure that what I teach in the classroom is effectively used on the job?'”
“I would estimate that only 10 percent of content which is presented in the classroom is reflected in behavioral change on the job. With increase demand from my management to demonstrate the effectiveness of training, I got to find a way to deal with the issue of transfer.”
Note that Georgenson actually uses quotation marks for the above statements — and the reason why is that he is asking a rhetorical question. Thus this 10% transfer myth is NOT based on any studies or research, but rather on a rhetorical question asked by an author! The are no studies or research cited in Georgenson's paper. In fact, Georgenson is not even a learning/training researcher, for the bio in the article reads, “David L. Georgenson is manager, product development, Xerox learning Systems, Stamford, Conn.”
NOTE: When I first started researching this bogus 10% figure, I spent quite some time tracing it to its roots. I could have saved myself some time if I found this article by Fitzpatrick and Thalheimer first.
Transfer of Training Rate
What is the real rate of transfer? I don't believe anyone has performed a complete study of it, however there is one study that surveyed members of a training and development society (Saks & Belcourt. 2006). They (see note below) reported an initial transfer rate of 62%.
Note: The participants included 150 members of a training and development society who reported working an average of 10.5 years in training and development and 10 years in their current organization. Their organizations employed an average of 5001,000 employees and comprise over a dozen sectors including manufacturing, service, and government.
Thus, 38% of training fails to initially transfer. There are two main reasons.
The first one is that some so called training programs are not really training, but rather more development or educational in nature, thus an initial transfer rate should not be expected. That is, training is done to show an immediate or near immediate improvement on the job, which means it should show a transfer rate. While development and educational programs are performed more to grow the learner over a period of time, thus we should expect lower transfer rates for development and education programs that for real training programs. Thus, the primary problem is that learning professionals fail to properly identify or categorize the type of learning program.
The second reason is of course that mistakes are made with the analysis or design of the learning program.
20% x 20% x 10% = 0.4% Myth
The article in Chief Learning Officer's magazine, The Low-Hanging Fruit is Tasty, and Jay Cross' book, Informal Learning presents the 20% x 20% x 10% = 0.4% formula:
- 10% to 20% of our training efforts transfer to the job (Brinkerhoff & Gill, Baldwin & Ford, & others).
- Training accounts for 10% of the potential for changing performance on the job (Rummler & Brache).
- Training departments only manage the 20% of the learning that is formal (80% is informal).
When multiplied together, this implies that training is responsible for less than 1% (0.4) of the potential change in performance on the job.
The first part of the formula was already disproved in the section: 10% Transfer of Training Myth
As to the second part, most trainers would probably agree or at least somewhat agree with the Rummler & Brache's research. From what I have seen, most place the percentage of training's potential for changing performance on the job somewhere between 10% and 20%.
When we take away the false claim on transfer of training we are left with two percentages: Rummler & Brache's assertion that training accounts for 10% of the potential for changing performance on the job and the assertion that training departments only manage 20% of the learning that is formal as 80% is informal.
So now we can reduce the formula to 10% x 20% = 2%. Now we can say that training accounts for 2% of “the potential change in performance on the job,” which is still not saying much. However, this disproves Rummler & Brache's assertion that training accounts for 10% of the potential for changing performance on the job. How can we use their number to disprove their number? This does not sound very logical.
The reason that this does not work is that the author is confounding the numbers by using two different things — training verses learning. This would be the same if we say we have half of an apple (training) and half of an orange (learning) then implying we only have 25% fruit (0.5 x 0.5 = .25). You cannot multiple training and learning and expect to get any type of logical answer as they are TWO DIFFERENT THINGS.
The bottom-line is that the formula uses very bad math.
Training and the Bottom Line
Myth: “Training has little effect on the bottom line. Clients are wasting their money by investing in it.” However, as reported by ASTD (ASTD 2004 State of the Industry Report): “Organizations are linking learning to performance and the bottom line, and they understand the relationship between creating a skilled workforce and achieving enterprise-wide success.”
ASTD reports: “Employee learning and development is taking center stage as business leaders increasingly understand that a highly skilled, knowledgeable workforce is critical to achieving growth and success. In its 2006 State of the Industry Report, the American Society for Training & Development (ASTD) finds that leading organizations increased learning investments in two key areas: annual expenditure per employee and learning hours.”
The majority of training activities are spent in the design and delivery of learning programs, however, our clients value business linkage the most (Trolley, 2006). Thus, we have to spend more time showing how training, development, and educational programs provide a real difference to the business. While the design and delivery of learning programs are important, it does us little good if the rest of the organization sees our activities as transactional rather than value-added. Trainers MUST spend more time showing how we do indeed improve performance and how our activities add value.
Generational Differences
Thomas Reeves (20006), reporting on generational differences, wrote that they, “are evident in the workplace, but they are not salient enough to warrant the specification of different instructional designs or the use of different learning technologies.” “On the other hand, both feasible solutions and reusable design principles are sorely needed with respect to the intersection of generational differences and instructional design. Instead of worrying about whether Boomers, GenXers or Millennials will learn more from direct instruction or virtual reality games, instructional designers and educational technology researchers working closely with practitioners and subject matter experts should begin by identifying the needs of any given set of learners, design the best possible prototype learning environments in situ [see Note], and then conduct iterative cycles of formative evaluation and refinement to optimize the solution and reveal robust design principles.”
However, that does not mean the culture is not out there. So while the newer generations may not warrant different instructional strategies, it does not mean they will tolerate the same old lectures, activities that have no real meaning to their work, two hour long classes that could have been learned at their desks in 30 minutes and other wasteful means that other generations have tolerated.
Talent management works best when you help to assimilate others' cultures into the organization when it makes sense to do so, rather than fight to keep your ways the sole means of conducting business. The real idea is to increase productivity. For the most part we have finally cut the non-complex transactional positions that benefit from productivity-stimulating technology. All that's left are complicated and nuanced jobs requiring experience, expertise, judgment, interaction, and collaboration — or tacit knowledge (Frei & Mader, 2008).
Downsizing
In a speech to the Academy of Management in 1996, Donald Hastings, CEO of lincoln Electric, called downsizing and rightsizing “dumbsizing.” Note that Lincoln Electric is one of the leaders in its field and has not laid off since its inception in 1948. Yet it has been through all the hard times like everyone else, but during lean times, it chooses to redeploy people rather than lay them off, e.g. factory workers start selling its products in the field. Another company, the Saturn Division of General Motors, did similar redeployments in the 1990s. Why? Because innovations, productivity improvements, etc. are not likely to be sustained over time when workers fear that they will work themselves out of a job (Locke, 1995).

“The evidence indicates that downsizing is guaranteed to accomplish only one thing — it makes organizations smaller.” (Pfeffer, 1998). In fact, the consequences of downsizing are stock prices that lag 5 to 45% behind the competition (in more than 1/2 the cases they lagged 17 to 48%), it does not necessarily increase productivity or profits, downsizing tends to be repetitive (2/3 of organizations repeat it the next year), it does not fix or improve core processes, it can be readily copied so it offers no competitive advantage, and it has unanticipated costs that limit its benefits.
Downsizing only works about 1/2 the time, thus firms are basically flipping a coin when they choose to downsize. With all the negative connotations associated with downsizing, very few firms use other means to avoid downsizing (1994 American Management Association survey). Downsizing is nothing more than a euphemism that refers to layoffs initiated by a company in order to cut labor costs. While the euphemism makes it less disturbing for the speaker to say it, it probably does nothing for the listeners.
Rather than downsizing, other possibilities include:
- reducing work hours
- reducing pay
- taking outsourced work back
- building inventories
- freeze hiring and reshuffle workers
- do training, maintenance, etc.
- refrain from hiring during peak demands
- encourage people to innovate (product, services, markets)
- transfer people to sales to build demand
Knowledge Economy
Wired magazine (13.04, p. 040) wrote that American companies earn more money from foreign firms outsourcing service jobs here than we loose from domestic companies sending service jobs overseas. In 2003 (the latest data available), U.S. businesses took in 61.4 billion by providing labor to foreign interests, while outsourcing 43.5 billion worth of jobs to other countries. Note that service jobs generally refer to work other than manufacturing, such as knowledge, health professions, insurance, etc.
In 1980, it appeared to be just about even with a couple billion being outsourced and insourced and then it took a fairly study rise to achieve our present 17.9B surplus.
By 2012, 80 percent of Americans will hold jobs in the service industry. It presently makes up about 60 percent of our workforce (BLS figures). Other countries with surpluses:
- United Kingdom 41.2B vs 19.7B
- India 18.6 B vs 11.8B
- Singapore 13.0B vs 9.2B
- China 10.4B vs 8.0B
These countries outsourced more service jobs:
- Germany 26.5B vs 41.4B
- France 23.1B vs 23.2B
- Netherlands 20.1B vs 20.1B
- Japan 17.4B vs 24.7B
- Austria 13.8B vs 16.6B
Note: Wired magazine's data was supplied by the International Monetary Fund's trade unit.
Class Size
The consensus is that class size is not a particularly important factor when the goal of instruction is the acquisition of subject matter knowledge and academic skills. This appears to hold true across various class types (e.g. lecture, discussion). However, smaller class sizes are somewhat more effective than larger ones when the goals of instruction are motivational, altitudinal, or higher-level cognitive processes. (Pascarella & Terenzini, 1991, p87).
Putting this in perspective with the training world - it depends. For example, I used to train heavy construction equipment (e.g. bulldozers, earth-moving scrapers, scooploaders, backhoes). We used a 4:1 learner to trainer ratio when instructing the practical exercises. When you are in a muddy field and you got 10 inches of red clay sticking to your boots and you are trying to train, coach, provide real life experiences, and at the same time be safety conscience due to the number of things that can happen with a beginner on a mega-ton piece of equipment, then you start to get the picture for such a low ratio.
Also, the 4:1 ratio is used in other aspects of training, but I believe it has more to do with being symmetrical (the trainer in the middle with a student at each corner), than it has to do with any real learning advantage.
During some diversity training I facilitated, the class sizes were kept small, under 10 learners, as the designers wanted to allow room for a lot of interaction to take place. So while one instance might call for small class sizes due to safety and the complexity of the training, another might be kept small to allow for certain activities to take place.
I believe the best approach is to analyze your training requirements, check on classroom facilities, and then choose your class size accordingly.
Personalized System of Instruction (PSI)
If you really want to be more effective, then use a better instructional strategy. The Personalized System of Instruction (PSI), also know as the Keller Plan, was developed by Fred Keller (1968). It is composed of small self-paced modularized units of instructions where study guides direct learners through the modules. Unit tests are given on each module where the learners must show mastery by scoring at least a 90%. Student proctors are used to help with individual problems and lectures are given for motivational problems only.
Pascarella and Terenzini's (1991, p91-93) reviewed seven different studies and concluded that “PSI is effective in fostering improved subject matter mastery over more conventional instructional approach. This is true regardless of whether the synthesis is quantitative or narrative.”
They also reviewed two meta-analytical syntheses of PSI and learning. The first was based on 19 studies and had an effect size of 0.42 of a standard deviation. The second one was based on 61 studies and had an effect size of 0.49 of a standard deviation which translates to an achievement advantage of 19 percentile points (in other words, if the conventionally taught groups were achieving at the 50th percentile, the PSI groups were, on the average, at the 69th percentile).
Active Learning
Pascarella and Terenzini (1991, p98) report that student involvement or engagement (active learning) be used since a substantial body of evidence suggests that the greater the learner's involvement in the learning process, then the greater the level of content acquisition. Also note that this involvement can be as simple as note taking, discussions, or answering questions.
Media
As long as the learning methods are similar, there is no evidence that one medium works better than another. Thus, an online course is just as effective as a classroom (and vice-versa) as long as the learning or instructional strategies remain the same (Clark, 2001).
Clark also wrote,
“The best current evidence is that media are mere vehicles that deliver instruction but do not influence student achievement any more than the truck that delivers our groceries causes a change in our nutrition.” [Reconsidering research on learning from media. Review of Educational Research, 53,(4), 445-459]
Now there are economic benefits to be had from media, but there is no evidence that it makes any unique contribution to learning.
With all that said, some media are closely related to learning methods. For example, graphics normally enhance the learning experience when used correctly (Clark & Lyons, 2004).
However, like anything else this does not always hold true. For example, if the goal is to encourage the learners to find an optimum solution to a problem, then performance will normally be facilitated if the instructions are presented in text rather than graphics and text, apparently paradoxically, because of the difficulty of working with this text — you become more drawn into the content (Ainsworth & Peevers, 2003). However, this normally takes longer. If the goal is to encourage quick task completion or if solutions are roughly equivalent, then the worst method is normally text, while the best seems to be audible and graphics.
I tend to believe this has to do with the same way our brains process art — when we look at a painting, our brains process its content before registering its style.
Thus, when the level of learning is low on the difficulty scale, learners first process the content and then they process the style (graphic), which in turn reinforces the content by drawing them more into the content that they need to learn. Basically, we are raising their arousal levels.
When we move up the difficulty level, such as having to make a judgment, then we need lower arousal lowers as this tends to aid creativity by allowing us to become more focused on details and becoming more analytical.
For more information, see Media, Methods, & Strategies
Note Taking
Robert Marzano (1998) performed a meta study and came up with these two findings on “Idea Representations:”
- Note taking techniques have an overall effect size of .99, indicating a percentile gain of 34 points. These techniques require students to generate personal linguistic representations of the information being presented.
- However, the instructional technique with the largest effect size within this information processing category was graphic representations. This technique produced a percentile gain in achievement of 39 points. One of the most effective of these techniques was semantic mapping (Toms-Bronowski, 1982) with an effect size of 1.48 (n=1), indicating a percentile gain of 43 points. With this technique, the learner represents the key ideas in a lesson as nodes (circles) with spokes depicting key details emanating from the node.
Thus, you get more bang for your bucks using graphic representations... when it comes to note taking, perhaps Mihai Nadin was right in that we are moving to a more visual type literacy (The Civilization of Illiteracy).
Another effective method is the Consolidation Method of Note Taking(Allan, 2015). With this method you write down as much information as possible without worry about how neat it looks. At the end of the week, before test time, or when you have a stack of notes, you lay them out and organize them by concepts. You then determine the most important and helpful and consolidate them on a single piece of paper.
The act of reorganizing the material into more manageable chunks also helps you to reorganize the material in your brain by connecting the new concepts to your existing mental models, which in turn makes it much easier to learn.
Instructor Effectiveness
“Teaching behavior systematically influence the acquisition of subject matter knowledge by students”(Pascarella & Terenzini, 1991, p94). There are six general dimensions of teacher effectiveness:
- Skill: pedagogical adroitness
- Rapport: empathy, accessibility, and friendliness
- Structure: plan and organizes the instruction
- Difficulty: the amount and difficulty of work expected
- Interaction: the extent to which students are encouraged to become actively involved
- Feedback: the extent to which feedback is provided on the quality of the student's work
The dimensions are largely independent of class size and “have statistically significant positive correlations with course achievement” (p95). In addition correlations between instructor rating and achievement were larger for full-time (verses part-time) faculty when an external evaluator (not an instructor) graded student's course achievement.
The two dimensions of teacher behavior that stand out as being particularly salient in terms of potential influence on learning are skill and structure. The positive association found between an instructor's skill and student learning depends more on instructor clarity and understandability than on constituent factors such as instructor subject matter knowledge or sensitivity to class level and progress.
In addition, some specific teacher behaviors that influence learning are the ability to use examples to illustrate concepts, identifying key points, and clearly signaling topic transitions (p96).
Prior subject matter and background in a content area affect the ways in which teachers select and structure content for teaching, choose activities and assignments for students, and use textbook and other curriculum materials. (Shulman & Grossman, 1988, p.12)
In another study (Marzano, 1998), the author paints a picture of an effective teacher (p135). He quotes Shulman who described the missing paradigm in education as one that bridged the gap between content knowledge and instructional techniques. Marzano suggests that this paradigm is the understanding of the relationships among the knowledge domains, the cognitive system, the metacognitive system, and the self-system, and uses that understanding to make a myriad of instructional decisions that occur in a single lesson. Note: for more information on these systems and domain see Learning Theories.
Informal Learning
Allen Tough, a Professor Emeritus at the University of Toronto, focused his research on the adult's successful efforts to learn and change; and in particular the 70% that are self-guided without relying much on professionals or institutions (informal learning). During his research, he discovered that people spend an average of 15 hours per week learning on their own.
In the late 1970s, Patrick Penland, a library school professor at the University of Pittsburgh, became quite interested in Tough's research. He performed a survey in which a section of it pertains to why learners prefer to learn on their own, rather than in a class or course. The main reasons, in ranking order, are:
- Desire to set my own learning pace.
- Desire to use my own style of learning.
- I wanted to keep the learning strategy flexible and easy to change.
- Desire to put my own structure on the learning project.
- I didn't know of any class that taught what I wanted to know.
- I wanted to learn this right away and couldn't wait until a class might start.
- Lack of time to engage in a group learning program.
- I don't like a formal classroom situation with a teacher.
- I don't have enough money for a course or class.
- Transportation to a class is too hard or expensive.
What is interesting about the survey is that for the most part, it is not that learners lack resources or hate attending formal classes, for these items are at the bottom of the rankings, but rather they prefer being in charge of their own learning.
In addition, the top items in the rankings show that while learners prefer to take charge of their own learning, it does not mean that they enjoy solitary learning. Tough discovered that within each informal learning episode (where the primary motivation is to gain and retain certain knowledge and skill on a task or thing), the average learner interacts with an average of 10 people. In fact, there may actually be more social interactions during informal learning episodes than there are in classrooms. Thus, we begin to get a picture of why blended learning became the next step in the elearning evolutionary process.
While the last two items pertain to a lack of resources, the first eight items show a desire to take charge (learner control) of one's own learning episodes. These eight design characteristics control or impact most learning episodes:
- Desire to set my own learning pace = self-pace.
- Desire to use my own style of learning = personalized.
- I wanted to keep the learning strategy flexible and easy to change = tactical.
- Desire to put my own structure on the learning project = empowerment.
- I didn't know of any class that taught what I wanted to know = complex.
- I wanted to learn this right away and couldn't wait until a class might start = just-in-time.
- Lack of time to engage in a group learning program = flexibility
- I don't like a formal classroom situation with a teacher = casual.
For more information, see Formal and informal Learning.
Laurie Bassi and Peter and Waterman
When Nicholas Carr wrote his famous article, Why IT Doesn't Matter, a torrent of debate followed. Rebuttals poured in from around the world. While Carr's insights provided a few wake-up calls to the IT industry, his assertions were nevertheless heavily challenged. IT professionals were outraged that he could so easily dismiss IT. It seems that if IT is viewed strictly as “Information Technology,” as Carr did, then he is correct, however IT is actually much more — it is also a “business process,” which makes it a lot more valuable. Thus, while Carr is somewhat correct in his assertions, he misses a very large concept of IT.
However, when a fellow trainer writes that training is useless or that it is snake-oil, the comments that follow such posts are mostly in agreement, “Oh dear you are quite correct — I'm nothing more than ugly wart on the corporation's behinney... its a wonder they don't cut me off and throw me away with the rest of the rubbish.” Pathetic!!!
When you toss other professionals a bone, they make something useful out of it, toss a trainer a bone and they bop themselves on the head with it. For example, I have posted several times about Laurie Bassi' s research that training investments are positively related to stock market performance, with those firms that spend more on training likely to outperform other firms in subsequent years. For example, a series of portfolios of firms that made the largest per capita investments in training subsequently returned 16.3% per year, compared with 10.7% for the S&P 500 index.
Yet, we just can't believe our profession is actually quite worthy, so we bush it off or reply that causality works both ways. I even had one person who I guess could not stand the idea of training actually being worthy, replied, “Bassi never maintained that her data proved causality, thus [I] was misusing her work.” But if that person would have read her work, he would seen that she wrote,
“While the performance controls in the regression above should prevent a spurious correlation between training and stock returns, we also show that training expenditures are not driven by past returns. This supports the thesis that training investments help to determine stock price performance, and not the opposite” (The Impact of U.S. Firms' Investments in Human Capital on Stock Prices, June 2004).
While causality is one of the hardest things to prove in science, her research does indicate that training is indeed valuable. In fact, investing larger percentages of money in people even beats out organizations that invest large numbers in R&D. People are indeed the most valuable asset of a corporation! Invest in them and the organizations grows! I always thought it would be kind of strange if causality did work the other way. Imagine a company beating out the S&P and then the leaders saying, “Hey, we got too much money here — what should we do with it?” “I know, let's go blow it on snake-oil.”
Beating the S&P is not easy, even good mutual fund managers have a hard time beating it. While Bassi beats it with a 16.3, another source comes to mind — the 43 corporations that Peter and Waterman listed In Search of Excellence brought an average return of 14.1% (that percentage is a few years old so it could be different by now — Forbes magazine 2002). Even though a couple of their companies tanked, an investor still would have made great deal money by investing in them. And it is interesting that it was the people within these companies that the authors zeroed in on, not the technologies.
So IT's business processes and the people in Peters and Waterman's book makes them valuable. But what makes training even more valuable? As Bassi noted, there is a powerful correlation between training expenditures per employee and a firms' customer retention rates. This can have a significant effect on firm performance - one study found that a 1 percent reduction in customer attrition can add as much as 5 percent to a company's bottom line. And people who receive training generally offer better service for two main reasons.
First they have better skills and knowledge. We often hear how learning is never transferred back to the job, yet some of the skills and knowledge do indeed stick. Go to enough training and the workers start to form their own mental models. And while they may just remember parts of the training, when they connect it with their own learning, they begin to form a powerful knowledge base. In addition, some things just take time. For example, when training in one organization that I use to work for introduced the Japanese concept of Kanban (card or sign — A method for tracking SKUs with a single card attached to each and then using a pull system), it was a difficult concept for many, yet slowly, but surely it become in use throughout the plant. And a year later, when the workers named one of meeting/classrooms the “Kanban Room” you know it was then in vogue.
Secondly, workers see training as a valuable benefit. And these benefits do bring some loyalty to an organization, which pays off in better customer service. Which might explain some of the surge in leadership training. The job market is slowly but surely tightening. Even getting good unskilled labor is getting slightly more difficult. And these workers are asking for training that will help them to advance. Thus the increase in leadership training. This is one very important reason why those level one evaluations are indeed important.
Organizations thrive on training. And employees see the value in training and it pays off. They want more of it! Yet we as trainers, along with our mangers and leaders, fail to see its value! We see it as being useless, a waste of money, snake-oil! Absolutely amazing! This is almost like the followers being better judges of their leaders than the leaders themselves or their seniors.
And we bop ourselves over the head even more. We are consistently looking for ROIs and other numbers that will prove our worthiness. . . but we don't look to hard because then we might have to start respecting training. Yet ask HRM professionals from Fortune 500 companies and the majority don't want bottom line numbers, but rather group synergy and individual employee development. They want results, not numbers.
Tidbits
Spaced practice (repetition) is generally more effective than a single practice or practicing the task several times without any timed spacing.
Transfer of learning from one context to another helps to quicken the learning process.
Feedback is generally beneficial for learners.
References
Ainsworth, S.E., Peevers, G.J. (2003). The Interaction between informational and computational properties of external representations on problem-solving and learning. Altmann, Kirsch (Eds.), Proceedings of 25th Annual Conference of the Cognitive Science Society.
Allan, P., (2015). Get More Out of Your Notes with the Consolidation Method. Lifehacker: http://lifehacker.com/get-more-out-of-your-notes-with-the-consolidation-metho-1716372981
Baldwin, T.T., Ford, J.K. (1988). Transfer of training: A review and directions for future research, Personnel Psychology, Vol. 41, pp.63-105.
Bassi, L. McMurrer, D. (2007). Maximizing Your Return on People. Harvard Business Review, March 2007, reprint R0703H.
Bassi, L., Gallager, A., Schroer, E. (1996). The ASTD Training Data Book. Alexandria, VA: American Society for Training and Development.
Chapman, B. (2006). PowerPoint to E-Learning Development Tools: Comparative Analysis of 20 Leading Systems. Sunnyvale, CA.: Brandon Hall Research.
Chapman, B. (2010). How Long Does it Take to Create Learning? [Research Study]. Published by Chapman Alliance LLC. Retrieved from: http://www.chapmanalliance.com/howlong/
Clark, R. (2001). Learning from Media: Arguments, Analysis, and Evidence. Greenwich, Connecticut: Information Age Publishing.
Clark, R. Chopeta, L. (2004). Graphics for Learning: Proven Guidelines for Planning, Designing, and Evaluating Visuals in Training Materials. Jossey-Bass/Pfeiffer.
Delahoussaye, M. Ellis, K. Bolch, M. (2002). Measuring Corporate Smarts. Training Magazine, August 2002. Pp. 20-35.
The eLearning Guild. (2002). The e-Learning Development Time Ratio Survey. Retrieved from: http://www.elearningguild.com/pdf/1/time%20to%20develop%20Survey.pdf
Fisher, A. (2005). Hot careers for the Next 10 Years. Fortune magazine, vol 151, No 6, p.13).
Frei, B. Mader, M. (2008). Perspective: The productivity paradox. C/Net News. Retrieved from: http://news.cnet.com/The-productivity-paradox/2010-1022_3-6228144.html?part=rss&tag=2547-1_3-0-5&subj=news
Georgenson, D. L. (1982). The Problem of Transfer Calls for Partnership. Training & Development Journal. Oct 82, Vol. 36, Issue 10, p75.
Keller, F. (1968). Good Bye Teacher. Journal of Applied Behavior Analysis, Spring; 1(1): 79–89.
Locke M. (1995). The transformation of Industrial Relations? A cross national review. The Comparative Political Economy of Industrial Relations. Wever, Turner (Eds.) IR Research Association: Champaign, Illinois. pp 18-19.
Marzano, R.J. (1998). A Theory-Based Meta-Analysis of Research on Instruction. Retrieved from: http://eric.ed.gov/?id=ED427087
Pascarella, E.T. Terenzini, P.T. (1991). How College Affects Students. San Francisco: Jossey Bass.
Pfeffer, J. (1998). Human Equation. Boston: Harvard Business School Press.
Reeves, T. (2006). Do Generational Differences Matter in Instructional Design? University of Georgia, U.S. Department of Labor, and UPS. Retrieved from: http://it.coe.uga.edu/itforum/Paper104/ReevesITForumJan08.pdf
Saks, A.M., Belcourt, M. (2006). An Investigation of Training Activities and Transfer of Training in Organizations. Human Resource Management, Winter 2006, Vol. 45, No. 4, Pp. 629648.
Shulman, L.S., Grossman, P.L. (1988). Knowledge Growth in Teaching: A final report to the Spencer Foundation. Stanford, CA: Stanford University.
Trolley, E. (2006). Lies About Learning. Israelite (ed.). Baltimore, Maryland: ASTD.
Toms-Bronowski, S. (1982). An investigation of the effectiveness of semantic mapping and semantic feature analysis with intermediate grade level children. Wisconsin Center for Education Research, University of Wisconsin, Madison, WI.
Training Magazine (2005). The State of the elearning Market. September, 2005.
Training Magazine, 2012. Training Industry Report. Retrieved from: http://www.trainingmag.com/content/2012-training-industry-report
Twitchell, S., Holton, E., Trott, J. (2000). Technical Training Evaluation Practices in the United States. Performance Improvement Quarterly, 13(3), 84-109.